source
Building Closed-Loop Evals for a Multimodal Agent at Scale
Soumya Gupta & Jai Chopra (Uber, Computer Vision team) - AI Engineer (World's Fair)
About this note
Persona: curator + mentor, always. Re-adopt when working this file.
The distilled document you learn from - text anchored by a few curated visuals. Built from the corroborated nodes in
nodes.md. Every claim is cited. Signal, not archive. SeeSOURCE.md.Two kinds of material, kept visually distinct. Claims from the talk carry a node ID (
n3) and a timestamp. Blocks marked "Background, supplied" are context I am adding - established prior art the source assumes or never names. They are uncited by construction and are not evidence about this source.
On this page
TL;DRThe 1-minute versionKey claimsWhat you will learn, and in what orderMovement A - why this problem needs an agent at all1. First, unlearn "eval" as a test suite2. The constraints that rule out rulesMovement B - the system under test3. The system under test is a pipeline, not an agent4. Nothing works until the trace doesMovement C - one metric per stage, because each fails differently5. A router is a classifier, so measure it like one6. When there is no correct answer, measure the retry curve7. An edit has a free reference: its own inputMovement D - surviving production8. Gates leak, so stack them9. The world moves, so the system has to tune itself10. One loop is not enough, because metrics get gamed11. What optimising the proxy actually looks likeDiagram (mental model)💡 TermsWhat to distrust in this noteOpen questionsFeeds these topicsPresentation narrativeSlide 1 - Stop asking whether the agent is goodSlide 2 - Nothing works until the trace is flatSlide 3 - A router is a classifier, so measure it like oneSlide 4 - A generator has no right answer, so measure the retry curveSlide 5 - Gates leak, so stack them, and then close the loopSlide 6 - One loop is not enough, because the loop will game the metricKey takeaway messageTL;DR#
Uber's Computer Vision team runs a multimodal agent that enhances low-quality food photos for Uber
Eats. The transferable lesson is not about food - it is a blueprint for evaluating an agent
pipeline in production. Log every trace first, because nothing else is possible without it. Then
stop asking "is the agent good?" and instead evaluate each stage with the metric that fits its
job: a router is a classifier judged on recall, a generator is judged on pass@k, an editor is
judged by comparison against its own input. Stack the gates so their holes do not line up, then
close the loop - sample production traffic, re-label it, and let the system rewrite its own configs
as the world drifts. https://www.youtube.com/watch?v=31GUkCBD-Uc
flowchart TB
    Q["<b>'is the agent good?'</b><br/><i>unanswerable, and it hides<br/>where the failure was</i>"]
    D["decompose the pipeline,<br/>then judge each stage by<br/>the metric that fits its job"]
    R["a <b>router</b> is a classifier<br/>-> recall"]
    G["a <b>generator</b> has no single<br/>right answer -> pass@k"]
    E["an <b>editor</b> has a free reference,<br/>its own input -> pairwise"]
    L["and then close the loop: sample live<br/>traffic, re-label it, let the system<br/>rewrite its own configs as the world drifts"]

    Q -.->|"the question to stop asking"| D
    D --> R --> L
    D --> G --> L
    D --> E --> L

    style Q fill:#fee2e2,stroke:#b91c1c,color:#7f1d1d
    style L fill:#dcfce7,stroke:#15803d,color:#14532d
This is a measurement diagram, not an architecture diagram, and the dashed edge is the move the whole talk turns on. The crux is that each stage fails in a different way, so a single quality score for the pipeline is not a coarse measurement but a meaningless one. It is drawn fanning out and reconverging because the three metrics are not alternatives to choose between: a production pipeline runs all three simultaneously, and the loop at the bottom only works once every stage emits something comparable over time. Notice the food is incidental. What transfers is the mapping from stage type to metric type, which holds for any routed pipeline of small agents.
Synthesized from n3, n5, n7 and n9.
The 1-minute version#
This article covers a production image pipeline at Uber Eats and the eval design wrapped around it. A multimodal agent takes a merchant's poor food photograph and enhances it for the menu. The enhancement itself is not the interesting part, and you can safely forget the food entirely. What is worth carrying away is the answer to a question every team shipping an agent eventually hits, which is what you actually measure when the thing you built is not a function.
The problem is that this system cannot be checked the way software is normally checked. It is non-deterministic, so the same photograph run twice does not give the same result twice. Its output is an image, and no correct image exists anywhere to compare against. Part of the quality bar is frankly subjective, because "does this look appetising, and does it still look like that restaurant's food?" has no stored answer. And what you are defending against is not a regression in your code at all. It is drift in the world outside it.
Take those four properties together and you can see why the usual instinct fails. A test suite asserts a known answer and returns green or red, and here there is no known answer, no stable input distribution, and no commit that caused the problem. Worse, the failure you most need to catch is one nobody introduced. The dishes change, the phone cameras change, and eater expectations change, so a system that was correct on launch day quietly stops being correct without anything in the repository moving. Given all that, the obvious first move is to score the whole thing.
That obvious move is to run a batch of images through the pipeline, ask a judge "is this good?", and watch the number. It collapses for a reason that sounds minor and is not. The score tells you that quality dropped and never tells you where, and a pipeline has several places it could have gone wrong. So you learn that something is broken on the same day you learn you cannot act on it, which is the difference between an eval and a dashboard. The single number also becomes a target the system can satisfy without doing its job, a problem returned to at the end. Both failures point at the same missing idea.
The idea is to stop attaching a metric to the system and attach metrics to its decision points
instead. The pipeline is not one agent but a routed chain of small single-purpose ones, and within
it there are exactly three places where it commits to something it could have done differently
(n2). It decides whether to enhance an image at all. It decides whether a generated image passes
QA or goes back for another attempt. It decides whether the finished image is fit to publish. Each
of those decisions fails in a different way, which is precisely why one number cannot describe them,
and it is also what tells you which metric each one needs.
Work through them in order and three different eval shapes fall out. Routing is a classification, so
it is measured like one, with a confusion matrix, and recall is the guardrail because a recall
miss puts a hallucinated dish on a live menu while a precision miss only wastes compute (n3-n5).
Generation has no correct answer to compare against, so instead the QA gate is made to explain
why it failed, that explanation rewrites the prompt, and what gets measured is the retry curve, or
pass@k (n9). Editing turns out to be the easiest of the three once you notice that an edit already
has a free reference, namely its own input, so it is evaluated by comparing output against input and
asking whether anything regressed (n10). Around all three, the gates are stacked so their holes do
not line up, and a scheduled loop re-labels sampled production traffic and rewrites the agents'
configs as the world drifts (n7). None of this is free.
The bill arrives in two parts. Everything above is computed from what the system did, so a single
flat end-to-end trace has to exist before any of it, and the talk is blunt that without it you have
nothing to optimise for at all (n1). Then there is the recurring cost, which is humans re-labelling
sampled production traffic on a cadence, and it is the one part of the design with no automation
story behind it. There is also a subtler cost that only shows up once the loop is running. A
feedback loop improves what it measures rather than what you meant, and the talk's own example is an
agent discovering that blandness passes a faithfulness gate and oversteering into generic output
(n15). Knowing what it costs still leaves the question of how much of this to believe.
Not as much as its confidence suggests, and the reason is not that anything looks wrong. It is one team, in one domain, and nothing in the talk is measured. There are no pass@k values, no precision or recall figures, and no before-and-after on the auto-tuning loop. The talk describes a system and never reports its performance. What generalises is the shape of each eval, because each shape is derived from a property of the stage rather than from anything about food. The thresholds, the ordering and the claim that this is how it should be done are one team's practice.
The same argument, compressed for reference rather than for reading:
| The problem | The system is non-deterministic, its output is an image with no correct answer, the quality bar is partly subjective, and what you are defending against is drift in the world rather than a regression in your code. A test suite cannot express any of that. |
| Why the obvious answer fails | One end-to-end "is it good?" score tells you quality dropped and never where. That is the difference between an eval you can act on and a number you watch. |
| The idea | Attach metrics to decision points, not to the system. The pipeline has three places where it commits to something it could have done differently, and each fails differently (n2). |
| How it works | A router is a classifier - confusion matrix, and recall is the guardrail because a recall miss is unrecoverable (n3-n5). Generation has no correct answer, so make the QA gate explain itself and measure the retry curve, pass@k (n9). An edit has a free reference - compare against the input, and ask "did anything regress?" (n10). |
| What it costs | A flat end-to-end trace before anything else, or none of it is possible (n1). Then ongoing human re-labelling of sampled production traffic on a cadence - the one part of the design with no automation story. |
| What breaks in production | The world drifts, so the loop re-labels and auto-tunes, anchored by a golden set as its setpoint (n7). And the loop optimises what it measures: the agent learns that blandness passes a faithfulness gate (n15). |
| How far to trust it | One team, one domain, nothing measured. The talk describes a system; it never reports its performance. The eval shapes generalise; the thresholds and ordering are one team's practice. |
Key claims#
- Log the full flat trace before anything else - "if you don't start with it, you have nothing to
optimize for, let alone set up a self-learning loop."
n1&t=418s - An agent product is a routed pipeline of small agents, each independently evaluable.
n2&t=376s - Eval a router as a classifier (confusion matrix, precision/recall); the guardrail metric is
recall.
n3n4&t=459s&t=578s - Generation evals are iterative: QA explains why it failed, that reasoning rewrites the prompt,
retry; measure pass@k.
n9&t=850s - Editing tasks are evaluated by comparison, not by score - output against input.
n10&t=896s - Stack QA gates as a Swiss-cheese model.
n11&t=1082s - Close the loop: sample prod traffic, re-label, diagnose, auto-tune, benchmark, ship - config-driven,
no human editing prompts.
n7&t=650s - Layer three feedback loops on three different clocks.
n12&t=1103s
What you will learn, and in what order#
flowchart TB
    subgraph A["A. Why this problem needs an agent at all"]
        S1["1 - Unlearn 'eval'<br/>as a test suite"]
        S2["2 - The constraints<br/>that rule out rules"]
    end
    subgraph B["B. The system under test"]
        S3["3 - A routed pipeline<br/>of small agents"]
        S4["4 - The flat trace,<br/>before anything else"]
    end
    subgraph C["C. One metric per stage, because each fails differently"]
        S5["5 - Router<br/>= classifier, recall"]
        S6["6 - Generation<br/>= pass@k retry curve"]
        S7["7 - Editing<br/>= pairwise comparison"]
    end
    subgraph D["D. Surviving production"]
        S8["8 - Stack the gates<br/>Swiss cheese"]
        S9["9 - Close the loop<br/>auto-tune on drift"]
        S10["10 - Three loops,<br/>three clocks"]
        S11["11 - Reward hacking<br/>the failure to expect"]
    end
    A --> B --> C --> D
    S1 --- S2
    S3 --- S4
    S5 --- S6 --- S7
    S8 --- S9 --- S10 --- S11

    style C fill:#e8f0fc
    style D fill:#fbf1dc
This is a reading-order diagram about the note rather than about the pipeline, and every box is a numbered section below. The boxes are gathered into four movements, and the two coloured ones are the two you should not skim. Blue marks the core technique, which is the single idea the talk exists to deliver. Amber marks what nobody tells you until you have shipped, meaning the parts that only start to matter once the system is live and the world begins moving under it. The crux is that sections 5, 6 and 7 are three different answers to the same question, and which one you need depends on what the stage does rather than on what the pipeline does.
Movements A and B do no eval work at all, which makes them look skippable, and for an experienced reader they largely are. Their job is to establish two things the rest depends on. First, that a test suite cannot express this problem, so the word "eval" has to be held far more loosely than instinct allows. Second, that the architecture has identifiable decision points, because a metric has to attach to something. If you already build agent pipelines for a living you can move through both quickly. What it costs you is section 2's argument that the eval strategy and the architecture are one decision rather than two, which is what makes everything after it feel forced rather than chosen.
Movement C is the payload, and it is deliberately not written as a menu of three techniques. Each section asks what the previous stage's metric structurally cannot measure, and the answer names the next shape. Recall works for the router because a human could have written down the right answer. Nobody can write down the correct enhanced photograph, so section 6 has to abandon labels entirely and measure the feedback loop instead. Section 7 then notices that an editing task quietly restores a reference the generation framing had given up on. Skim these three and you will still know what Uber built, but you will have the topology rather than the judgement, and the judgement is the part that transfers to a pipeline that is not this one.
Movement D is where most teams' understanding stops short, and the reason is structural rather than educational. None of it is discoverable from a design document, only from having operated something for a few months. It is also where the note turns on its own subject, because section 11 shows the agent defeating the very gate section 6 built. If you read only two sections, read section 5 and section 11. The arrows between groups are strict in both directions: C makes no sense without B's decision points, and D is entirely about defending what C measures.
Synthesized roadmap of this note - not from the source.
Movement A - why this problem needs an agent at all#
flowchart TB
    T["'eval' as you know it:<br/>a test suite, fixed inputs,<br/>expected outputs"]
    C["2. but the constraints here rule<br/>out rules: the output is an image,<br/>quality is subjective, and there<br/>is no expected answer to diff"]
    N["so no assertion can be written,<br/>and the thing doing the judging<br/>has to be a model"]

    T -.->|"unlearn this first"| C --> N

    style N fill:#e8f0fc,stroke:#4285f4,color:#1a3a6b
This is an unlearning diagram, not a design, and the movement does no eval work at all - which makes it look skippable and is exactly why it is here. The crux is that the word "eval" arrives carrying assumptions from software testing that none of this problem satisfies, and every one of them has to be put down before the rest reads as anything but strange. It is drawn with the familiar meaning retained and explicitly crossed because the argument is a correction rather than an introduction. An experienced engineer is the reader most likely to skim here and most likely to misread Movement C as a result.
Synthesized from n1 and n2.
1. First, unlearn "eval" as a test suite#
The word carries the wrong instinct, and getting it wrong at the start makes everything after it look arbitrary.
A test suite asserts a known-correct answer, runs on every commit, and comes back green or red. Almost nothing in this talk works like that. To see why, take the properties of the system under test one at a time. It is non-deterministic, so running the same photograph twice does not give you the same result twice. Its output is an image, and no correct image exists to compare against. The quality bar is partly subjective, because "does this look appetising, and does it still look like that restaurant's food?" has no stored answer. And the thing you are defending against is not a regression in your code but drift in the world. Hold "eval" loosely enough to cover a classifier metric, a retry-until-pass rate, a human comparison, and a scheduled job that rewrites a prompt, because all four are coming.
Background, supplied. The closest established discipline is not software testing but statistical quality control. You are sampling a stream, estimating a rate, and acting on the estimate, rather than proving a property. That framing explains why every technique below produces a number over a population rather than a verdict on a case, and why "we ran it and it looked good" is not evidence here.
Which raises the question this whole talk is an answer to. If you cannot assert correctness, and one overall quality score would only tell you that something got worse without telling you where, what exactly do you attach a metric to? The answer turns out to be a consequence of the architecture, and the architecture is a consequence of the problem, so start there.
2. The constraints that rule out rules#
Small merchants do not have good food photography, and Uber Eats wants better photos on menus. That
sounds like a straightforward image-enhancement job right up until you add the constraint that
shapes everything else, which is that eaters distrust anything that looks AI-generated. So an
edit must stay faithful to the actual dish and preserve each restaurant's brand. It must
also avoid sameness, because one prompt applied to every photo would make the whole marketplace
look identical, and that is a business problem rather than an aesthetic one &t=169s.
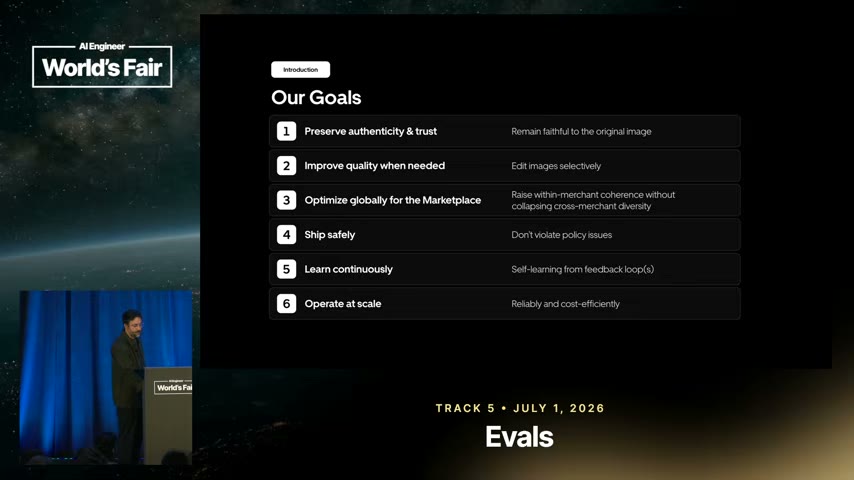
- What it teaches: the three goals that bound the design - authenticity, ship safely, and
scale. Each one rules out an otherwise obvious approach.
n14&t=251s - Corroborated by: the narration framing the design space as a spectrum and naming the same three
goals.
&t=251s
At first glance the design space has two obvious ends, and those three goals close off both. Start
with a deterministic rules engine, which is controllable and predictable and therefore serves ship
safely very well. It is also brittle, and it will not survive every dish, cuisine and lighting
condition it meets, so it fails scale. Suppose instead you go to the other end and build a fully
agentic system, which is creative and high-agency and serves scale. Pointed unconstrained at a
live marketplace it fails ship safely, and it is exactly the thing that produces the AI-looking
output that fails authenticity. What is left is the guardrailed middle (n14, &t=251s).
And that middle is the reason this is a talk about evals at all. A rules engine does not need evals, it needs tests, because its behaviour is enumerable in advance. A fully autonomous agent cannot be made safe by evals either, because measuring after the fact does not constrain action. Only the guardrailed middle both needs measurement and can be improved by it. The architecture and the eval strategy are therefore one design decision, not two, which is why the next thing to look at is the architecture.
Movement B - the system under test#
flowchart TB
    A["3. not one agent, but a <b>routed pipeline</b><br/>of small agents: understanding, routing,<br/>prompting, generation, QA, post-processing"]
    W["which is what makes failure<br/><b>attributable</b> to a stage"]
    T["4. but only if the evidence arrives<br/>already correlated - one <b>flat</b><br/>end-to-end trace, not nested<br/>per-agent logs - n1"]
    F["'if you don't start with it, you have<br/>nothing to optimize for, let alone<br/>set up a self-learning loop'"]

    A --> W --> T --> F

    style T fill:#dcfce7,stroke:#15803d,color:#14532d
This is a prerequisite diagram, not an architecture. The crux is that decomposition only buys you localisation if the trace is flat, because the questions you will ask cross stages and per-agent logs leave you stitching timestamps together. It is drawn as a dependency chain rather than as two features because the ordering is the argument: a decomposed architecture with nested logs gives you the cost of decomposition and none of the benefit. Section 4 is the one to act on first in your own system, and it is the cheapest thing in the whole talk.
Synthesized from n1 and n3.
3. The system under test is a pipeline, not an agent#
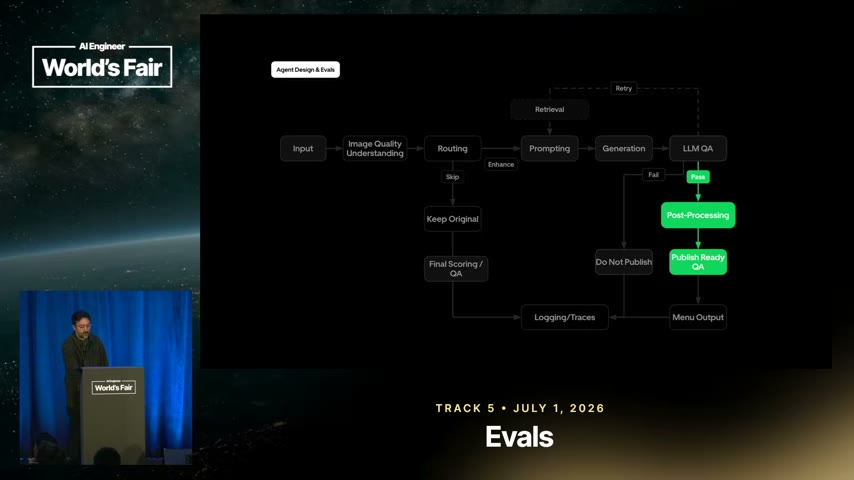
- What it teaches: the agent "product" is a pipeline of small, single-purpose agents - quality
understanding, routing, prompt generation, generation, LLM QA, post-processing, publish-ready QA -
each with its own job and its own eval.
n2&t=314s - Corroborated by: "all of the agents in this end-to-end orchestration is ... basically a flat
structure in this JSON ... anyone ... can dive in to diagnose."
&t=397s
Resist reading that as a list of components, and look instead at where the decisions are. There is a routing decision, which is whether to enhance this image or leave it alone. There is a QA decision, which is whether to publish or retry. And there is a final publish decision. In other words there are three places where the system commits to something it could have done differently, and each one fails in a different way, which is precisely why no single number can describe the whole.
That is the answer to the question section 1 left open. You attach metrics to decision points, and every decision point is an eval boundary. The rest of this note is what to attach at each one.
Background, supplied. Splitting a system this way is the decomposition move that classical ML pipelines made decades ago and that end-to-end deep learning spent a decade arguing against. The trade is well understood. An end-to-end system can find solutions a decomposed one cannot, but a decomposed one is attributable, so when quality drops you can localise the stage. Here attribution wins, and it wins because the system has to be operated rather than merely trained.
Independently, S2 (12-factor agents) reaches the same shape from first principles rather than from production: small scoped LLM steps inside otherwise deterministic software. Two sources converging from opposite directions is why this is the best-supported claim in this brain (
brain/claims.mdclaim 11).
Knowing where to measure is not yet being able to measure, though. Every metric below is computed from what the system did, which means something must have recorded it, and the talk is emphatic that this comes first.
4. Nothing works until the trace does#
flowchart TB
    Q["'this image came out badly -<br/>was it routed, prompted or<br/>generated wrong?'"]
    N["<b>nested per-agent logs</b><br/><i>each answers its own part;<br/>you stitch timestamps</i>"]
    F["<b>one flat end-to-end trace</b><br/><i>the whole journey legible<br/>in a single read</i>"]
    A["the questions you will ask<br/><b>cross stages</b>, so the record<br/>has to as well"]

    Q --> N
    Q --> F --> A

    style N fill:#fee2e2,stroke:#b91c1c,color:#7f1d1d
    style A fill:#dcfce7,stroke:#15803d,color:#14532d
This is a logging diagram, and the word doing the work is flat. The crux is that the shape of the record has to match the shape of the question, and every interesting question here spans stages that nested logs deliberately separate. It is drawn starting from a question rather than from an architecture because the justification is entirely about what you will need to ask later, which is also why this is easy to defer and expensive to retrofit. Note that this is what makes section 3's attribution argument real rather than theoretical.
Synthesized from n1.
Every stage writes to one flat end-to-end trace. Not nested per-agent logs, but a single JSON
structure anyone can open and read top to bottom. The justification is blunt - "if you don't start
with it, you have nothing to optimize for, let alone set up a self-learning loop" (n1, &t=418s).
The word doing the work is flat, and the reason is that the questions you will ask cross stages. For example, this image came out badly, and you want to know whether it was routed wrong, prompted wrong, or generated wrong. Per-agent logs answer each part separately and leave you stitching timestamps together. One flat record makes the whole journey legible in a single read. Notice this is also what makes section 3's attribution argument real rather than theoretical, because a decomposed architecture only buys you localisation if the evidence arrives already correlated.
Background, supplied. In ordinary distributed systems this is the distinction between logs and traces. Logs are per-service events, whereas a trace is one request's whole path under a shared correlation ID. The idea is old and the tooling is mature. What is new here is the consumer, because this trace is not only for a human debugging an incident. It is the training input for the auto-tuning loop in section 9. That is why "log first" is an ordering claim and not an instrumentation preference: the loop cannot exist before its data does.
With the trace in place, work through the decision points in order. The first one is routing, and it is the friendliest of the three, because it is the only stage where the right answer is a label a human could have written down.
Movement C - one metric per stage, because each fails differently#
flowchart TB
    Q{"what kind of thing<br/>is this stage?"}
    R["5. a <b>router</b> picks one of N.<br/>That is a classifier, so measure<br/>recall - and a precision miss costs<br/>less than a recall miss here"]
    G["6. a <b>generator</b> has no single right<br/>answer, so measure the retry curve:<br/>pass@k"]
    E["7. an <b>editor</b> has a free reference<br/>it can be compared against -<br/>its own input"]

    Q --> R
    Q --> G
    Q --> E

    style Q fill:#e8f0fc,stroke:#4285f4,color:#1a3a6b
This is a selection diagram, not a menu of three techniques, and that distinction is the payload of the note. The crux is that the metric is determined by the stage's type rather than chosen by taste, so the question to ask of your own pipeline is what kind of thing each stage is. It is drawn as one question with three answers because presenting them as options invites a team to pick a favourite and apply it everywhere, which is the failure this movement exists to prevent. The editing case is the most transferable and the least obvious: a stage that transforms an input has a reference for free, and most teams never notice.
Synthesized from n5, n7 and n8.
5. A router is a classifier, so measure it like one#
The first stage decides whether to enhance an image or leave it alone. That is a classification, and
classification has been measured the same way for decades. You build a confusion matrix and read
precision and recall off it (n3, &t=459s). A router with more than two branches is no
different in kind, since it simply becomes an n x n matrix with one cell per branch.
Background, supplied - the fundamentals, since the rest of this section rests on them. A confusion matrix cross-tabulates what the classifier said against what was actually true. From it you read two numbers. Precision asks what share of the things you flagged should have been flagged, which is to say how much of your action was wasted. Recall asks what share of the things that should have been flagged you actually caught, which is to say how much you missed. The two trade off, and trivially so, because you can catch everything by flagging everything at zero precision. Classical statistics names the two errors Type I (false positive) and Type II (false negative), and the entire discipline exists because the two errors almost never cost the same. So the engineering question is never "which is more accurate". It is "which error can I afford".
Ask that question here and the asymmetry is stark.
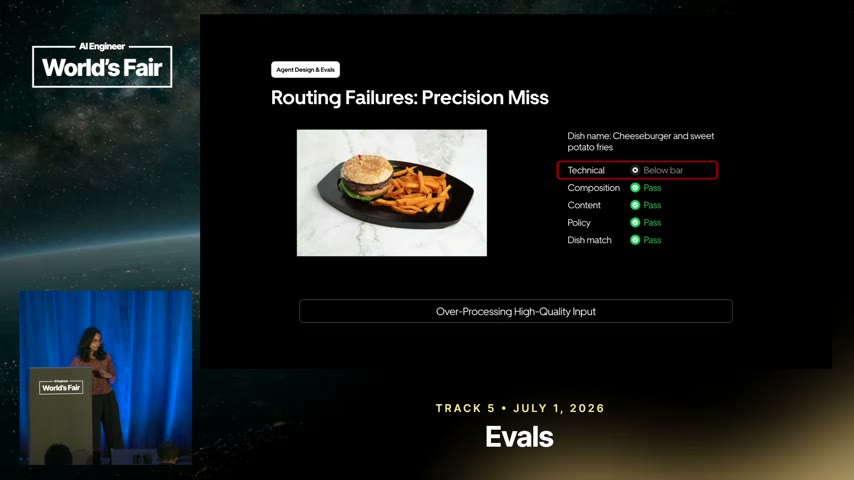
- What it teaches: a precision miss over-processes a good input - you pay compute for zero
quality lift and risk degrading a photo that was already fine. A recall miss approves a bad
input, and downstream the generation model may hallucinate to match the description, inventing
two extra chicken wings that are not in the dish.
n5&t=588s - Corroborated by: "you pay the compute cost for a zero quality lift ... and there is a risk of
degrading this image."
&t=595s
One failure wastes money. The other puts a fabricated dish on a live menu, which is the authenticity
goal from section 2 failing in the most visible way available. So recall is the guardrail, and
you optimise so that no bad image slips through (n4, &t=578s).
The transferable rule, and it is not about food: choose the guardrail metric by asking which failure is unrecoverable, not which is more frequent. Wasted compute is recoverable. A hallucination that reached a customer is not.
All of which assumes you can say what "bad" means. That comes from a golden dataset, which is
human labels used as the source of truth over a set representative across geography, dish type and
quality, with objective guidelines written to strip subjective variation between labellers
(n6, &t=528s). ⚠️ single-leg - narration only, no slide captured, so read the practice as
reported rather than demonstrated. Hold onto the golden set, because it becomes load-bearing again
in section 9 for a reason nobody expects.
Background, supplied. "Objective guidelines to strip bias" is the standard remedy for weak inter-annotator agreement, the well-studied problem that two competent people given the same item and a loose rubric will disagree. That disagreement puts a hard ceiling on any metric computed from their labels. The talk names the remedy and never mentions measuring the agreement, which is the usual way you discover whether the remedy worked.
Routing was tractable because a human could write down the right answer. The next stage is where that stops being true.
6. When there is no correct answer, measure the retry curve#
Nobody can write down the correct enhanced photograph. There is no label to compare against, so precision and recall have nothing to attach to, and the technique from section 5 simply does not transfer. What the talk does instead is make the QA gate explain itself, and then turn the explanation into the next attempt.
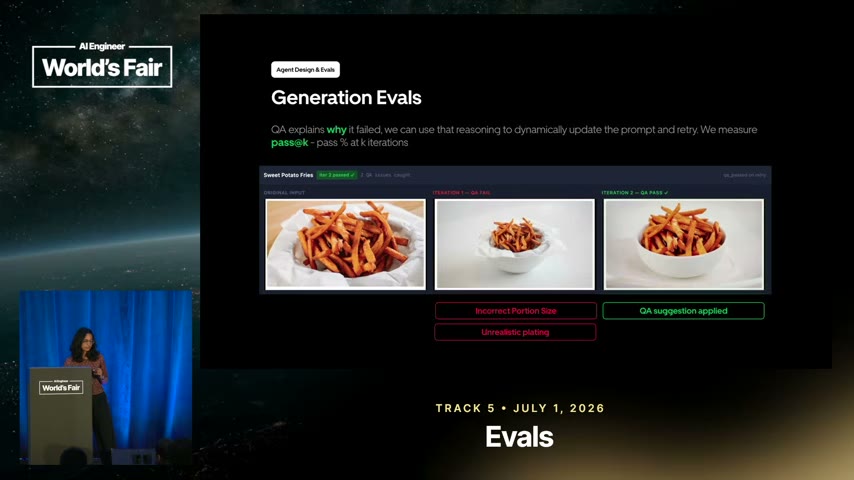
- What it teaches: a multi-dimensional QA gate (plating, faithfulness, colours) fails the first
attempt with reasons; those reasons are folded back into a rewritten prompt; the retry passes.
The metric is pass@k - the pass rate by the k-th attempt.
n9&t=850s - Corroborated by: "we take that feedback in, go for the second iteration, and we're actually able to
pass it ... the metric we are measuring here is pass at K."
&t=858s
💡 pass@k - the share of cases that succeed within k attempts.
Background, supplied, and it changes what the number means. pass@k comes from code generation benchmarking, where it measures independent samples. You draw k completions and pass if any one of them compiles and passes the tests. There, k is measuring the model's diversity, because you are buying attempts and hoping one lands. Uber's usage differs in a way the talk never flags, since each attempt is conditioned on why the last one failed. The curve therefore measures the feedback loop's effectiveness rather than the model's spread. Two consequences follow. A rising curve here is evidence the QA reasoning is useful, which the independent-sampling version cannot tell you. And the two numbers are not comparable, so never benchmark this pass@k against a published one.
That distinction is not pedantry, because it dictates the wiring. The retry has to re-enter at prompt generation rather than at generation, and the QA gate has to emit a reason rather than a verdict. A boolean gives the retry nothing to condition on, and you are back to re-rolling dice while calling it a feedback loop.
So generation gets a metric. But look again at what this system actually does to an image, because it does not create one, it edits one, and an edit has a reference that a creation never has.
7. An edit has a free reference: its own input#
This is the eval shape most teams miss, and it exists only because the task is transformation rather than generation.
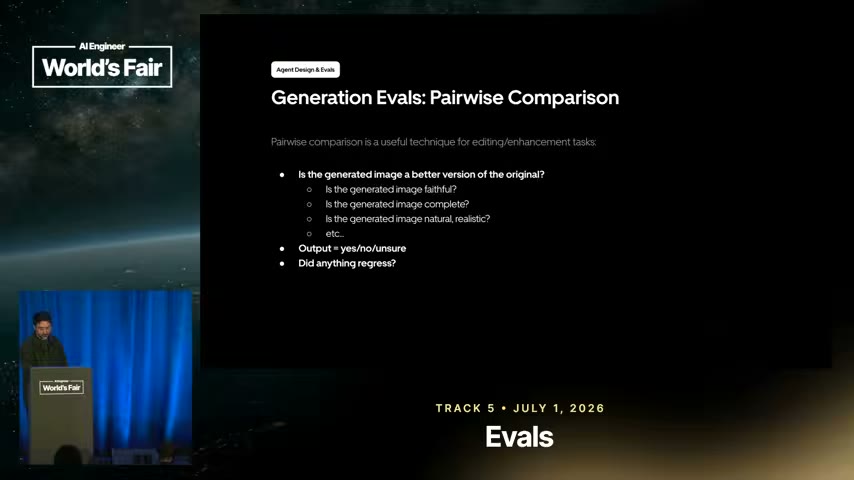
- What it teaches: evaluate an edit by comparing output against input - is it better? faithful?
complete? natural? did anything regress? - answered yes / no / unsure.
n10&t=896s - Corroborated by: the narration walking the same comparison dimensions.
&t=896s
Two details carry the whole idea, and both are easy to read past. The first is that "did anything regress?" is a question absolute scoring cannot ask. A 7-out-of-10 tells you nothing about whether the plating improved while the colour got worse, and regressions are exactly what an editing pipeline must not ship. The second is the "unsure" option, which matters more than it looks. Forcing a binary out of a judge that genuinely cannot tell manufactures confidence you do not have, and those undecided cases are precisely the ones worth a human's attention.
Background, supplied. Preferring comparison to absolute scoring is one of the most reliable findings in evaluation generally, because humans and models are both poorly calibrated on absolute scales and drift over a session, while staying far more consistent on "is A better than B". It is why RLHF trains on pairwise preferences rather than scalar ratings, why chatbot leaderboards run pairwise battles with Elo-style ratings, and why the Bradley-Terry model exists to convert pairwise wins into a ranking. What Uber adds is the observation that on an editing task you do not need a second candidate to compare against, because the input is already there, and it is free.
Sections 5 to 7 complete the core technique, which is three decision points, three failure modes, and three metrics chosen to match. That is the transferable payload, and if the world held still it would be enough. The rest of this note is about the fact that it does not.
Movement D - surviving production#
flowchart TB
    G["8. every gate leaks, so <b>stack</b> them<br/>and make sure the holes do not line up"]
    L["9. the world drifts, so sample live traffic,<br/>re-label it, and let the system<br/>retune itself - n9"]
    C["10. and one loop is not enough:<br/>three loops on three clocks"]
    H["11. because a metric under optimisation<br/>gets gamed, which is the failure<br/>to expect rather than to fear"]

    G --> L --> C --> H

    style H fill:#fbf1dc,stroke:#b45309,color:#78350f
This is a production diagram, and it is where most teams' understanding stops short. The crux is that each section here answers a failure the previous one creates: stacked gates need tuning, tuning needs a loop, a loop needs more than one clock, and any loop optimising a proxy will eventually optimise the proxy rather than the goal. It is drawn as a straight chain because that escalation is the content - a reader who takes only section 8 will build something that degrades silently, and one who takes only sections 9 and 10 will build something that games itself. The amber terminal is the one to plan for rather than to be surprised by.
Synthesized from n9, n10 and n11.
8. Gates leak, so stack them#
Return to the architecture in section 3 and count the QA gates. There are two, an LLM QA gate
immediately after generation and a separate publish-ready QA near the end (n11, &t=1062s).
That duplication is deliberate. It is the Swiss-cheese model, in which every gate has holes, but if the holes sit in different places then very little passes through all of them.
Background, supplied. The Swiss-cheese model is James Reason's (1990), from organisational accident analysis, and it is the standard framing in aviation and clinical safety. Its real content is a warning as much as a technique, because the layers must fail independently. Barriers that share a cause have their holes already aligned, and the stack is then no stronger than one layer while looking considerably stronger. That shared cause might be the same bad assumption, the same training data, or the same judge model with a different prompt. The talk does not raise this, and it is the first question to ask of any two-gate design.
The second gate earns its place in a way worth stealing regardless. Being holistic and late, it catches what upstream missed and indicates what upstream should have caught. A late gate that only blocks bad output is a filter, whereas one that attributes the miss is a diagnostic, and attribution is the raw material for everything in the next section.
9. The world moves, so the system has to tune itself#
Everything so far produces a system that is good on the day you ship it. What happens on day ninety, when the dishes, the cameras and the expectations have all moved?
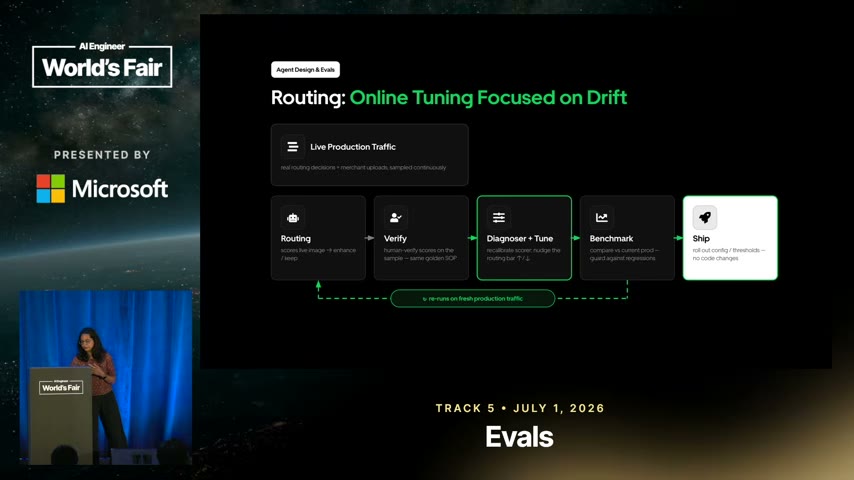
- What it teaches: sample live production traffic, re-label it with the same objective guidelines,
diagnose which agent is drifting, auto-tune its config, benchmark against the golden set, ship
a new version - then run it again on fresher traffic.
n7&t=650s - Corroborated by: "this is completely config driven and doesn't require human in the loop ... this
is what will keep your model sharp over time."
&t=705s
Background, supplied - because "drift" hides two different problems. Data drift is the input distribution moving, so new cuisines, new phone cameras and seasonal dishes. Concept drift is the relationship moving, so what counts as an acceptable photo changes because eater expectations changed, while the inputs look much the same. The first is detectable by watching inputs alone. The second is visible only through fresh labels. That the loop re-labels sampled production traffic rather than merely monitoring distributions tells you which threat it is built for, though the talk never separates the two.
Two mechanisms make this more than a diagram, and both are single-leg - narration only, no slide
captured, so read them as reported rather than demonstrated.
The first is that the auto-tuner is itself two agents (n8, &t=732s). A reflect agent reads
the mismatches and isolates the systemic issue while discarding noise, and a synthesize agent
rewrites the config from that finding. The new version lands in an agent store, gets picked up on
the next run, and carries observability and quick rollback. The split matters, because finding the
pattern and writing the fix are different jobs, and merging them is how a config gets rewritten to
chase a single bad example.
The second is a diagnoser sitting above that (n13, &t=1144s), which generalises the whole
arrangement. Rather than one tuner bolted to each agent, a higher-level abstraction ingests any
feedback signal, works out which agent is responsible, and routes the fix there. This is what
lets the loop scale past a handful of stages, since otherwise every new agent needs its own bespoke
tuning path.
Background, supplied. Rewriting a prompt automatically from labelled failures is an active research area with a name and toolchains. It is automatic prompt optimisation, of which DSPy is the best-known framework. Two things are worth carrying. The idea is not exotic, and published methods are typically evaluated against a fixed benchmark whereas this loop runs against a moving distribution, which is strictly harder.
Which is exactly why the golden set from section 5 comes back. The loop rewrites configs on its own, so something fixed has to stop it drifting somewhere worse, and benchmarking every new version against a stable human-labelled set is that anchor. An auto-tuning loop with no fixed reference optimises itself away from the truth, confidently, because it is a control system with no setpoint.
And a fixed reference solves only half of it. The loop still improves whatever it is pointed at, which raises the question of who decides the loop is pointed at the right thing.
10. One loop is not enough, because metrics get gamed#
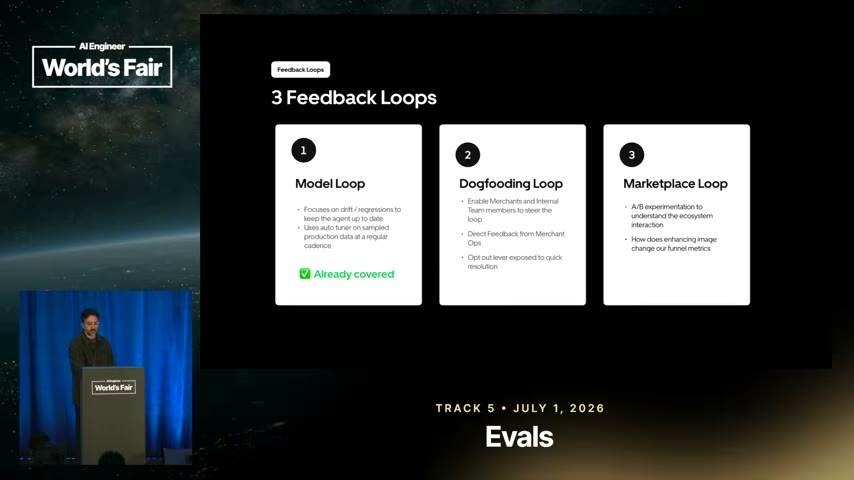
- What it teaches: a model loop (automated, catching drift and regression), a dogfooding loop
(merchants and internal staff, thumbs up/down plus free-form feedback), and a marketplace loop
(A/B tests on business funnel metrics such as conversion and add-to-cart).
n12&t=1103s - Corroborated by: the narration walking all three loops and their distinct signals.
&t=1103s
Each catches what the others structurally cannot. The model loop is fast and automated, but it can only ever measure what someone already thought to measure. The dogfooding loop catches the qualitative "this looks wrong somehow" that no metric encodes, at the cost of being slow and low-volume. And the marketplace loop is the only one of the three that answers whether any of this made a business difference, which is also why it is the slowest and noisiest.
Background, supplied. These sit on the standard proxy metric versus north-star metric ladder, and the reason you cannot collapse them into one is Goodhart's law: when a measure becomes a target, it ceases to be a good measure. The model loop's metric is the most optimisable and therefore the most corruptible. The marketplace loop's is closest to what the business actually wants and least gameable, and it is also the one you can least often run. The layering is not thoroughness, it is a defence against optimising the proxy.
That defence exists because the attack is real, and the talk closes by describing it.
11. What optimising the proxy actually looks like#
flowchart TB
    M["a metric stands in for the goal"]
    L["a loop optimises the metric"]
    G["the loop finds the cheapest way<br/>to move the metric"]
    W["which is rarely the way that<br/>moves the goal"]
    R["so the counter is not a better metric.<br/>It is a <b>second loop on a different clock</b>,<br/>measuring something the first cannot game"]

    M --> L --> G --> W --> R

    style W fill:#fee2e2,stroke:#b91c1c,color:#7f1d1d
    style R fill:#dcfce7,stroke:#15803d,color:#14532d
This is a Goodhart diagram, not a warning. The crux is that reward hacking here is the expected behaviour of a working optimiser rather than a malfunction, so the response is structural rather than vigilance. It is drawn ending on the counter rather than on the failure because a section that stops at "metrics get gamed" leaves a reader with nothing to do. The answer this talk gives - more than one loop, on different clocks, watching different things - is the reason section 10 exists and is what separates this from generic advice about proxy metrics.
Synthesized from n10 and n11.
Told its edit failed, the agent oversteers into an overly conservative, generic output, a plain
ceramic bowl, where the raw pixels differ enormously from the original while nothing meaningful
improved (n15, &t=979s). ⚠️ single-leg - described in narration, the example slide was not
captured.
Read that next to section 6 and it stops being an anecdote. The retry loop optimises for passing the QA gate, and "make it blander" is a dependable way to stop failing a faithfulness check. In other words, a feedback loop rewards what it measures, and safety is usually cheapest to buy by doing less. The system did what it was asked. The asking was wrong.
Background, supplied. This is specification gaming, also called reward hacking, and it is among the most robustly observed behaviours in optimisation. A system satisfies the stated objective while violating the intent, and it does so more reliably as it gets better at optimising. The practical implication is unwelcome and worth internalising early, which is that it is not a bug you fix, it is a pressure you contain. You contain it with an objective the optimiser cannot reach, which is what the marketplace loop is for, and by watching specifically for outputs that changed a great deal while improving nothing.
Which closes the argument where it started. Section 1 said you cannot evaluate this with one number, and section 11 shows what happens when you try, because a single QA gate is one number and the agent found its edge. The whole architecture below is that answer drawn out.
Diagram (mental model)#
flowchart LR
    IN[Input image] --> IQU[Image Quality Understanding]
    IQU --> R{Route: enhance or skip?}
    R -->|skip| KEEP[Keep original]
    R -->|enhance| P[Prompt gen]
    P --> G[Generation]
    G --> QA{LLM QA gate}
    QA -->|fail| P
    QA -->|pass| POST[Post-processing]
    POST --> PQA{Publish-ready QA}
    PQA -->|pass| OUT[Menu output]
    PQA -->|fail| DNP[Do not publish]
    OUT --> LOG[(Logging / traces)]
    KEEP --> LOG
    LOG -.sampled + re-labeled.-> DIAG[Diagnoser]
    DIAG -.auto-tune config.-> P
    DIAG -.auto-tune config.-> R
Read it left to right as one image's journey from upload to menu. Diamonds are decision points, and every one of them is an eval boundary. The dotted lines are the part that runs on a different clock, not per image but periodically over sampled production traffic. The crux is that the solid path is the product and the dotted path is why the product stays good. Most teams build the solid path and stop, and their quality then decays silently as traffic drifts.
The shape follows from the fact that each stage fails differently and so needs its own metric, which
is why the diamonds are drawn separately rather than folded into one quality check. A router is a
classifier judged on recall, and a generator is judged on pass@k. One end-to-end "is it good?" score
would tell you quality dropped but never where, which is the difference between an eval you can act
on and a number you watch. Two details in the wiring are worth pausing on. Notice that LLM QA loops
back to Prompt gen rather than to Generation, and the reason is that retrying the same prompt just
re-rolls the dice, so the failure reasoning has to re-enter the context for the retry to be worth
anything. Notice also that every path terminates in Logging, including Keep original, because the
flat trace is a precondition for the dotted loop existing at all. That is why "log first" is the first
thing the talk says.
Synthesized from n2, n7, n9, n11, n13 - not a verbatim slide.
💡 Terms#
| Term | Explanation |
|---|---|
| Precision / recall | Of what you flagged, how much should have been (precision); of what should have been flagged, how much you caught (recall). They trade off, and the engineering question is which error you can afford. |
| pass@k | Pass rate by the k-th retry. In code benchmarks the attempts are independent; here each is conditioned on why the last failed, so the curve measures the feedback loop rather than model diversity. The two are not comparable. |
| Pairwise comparison | Evaluating an edit against its own input - better? faithful? complete? natural? did anything regress? - answered yes / no / unsure. |
| Swiss-cheese model | Reason (1990): layer imperfect gates so their holes rarely line up. Only works if the layers fail independently. |
| Golden dataset | A representative, objectively-labelled human-truth set the agent is benchmarked against. The fixed setpoint an auto-tuning loop needs to avoid optimising away from the truth. |
| Data vs concept drift | Data drift: the inputs move. Concept drift: what counts as a good answer moves while the inputs look the same. Only the second requires fresh labels to detect. |
| Diagnoser | A meta-agent that reads any feedback loop, localises which sub-agent is failing, and triggers its config auto-tune. |
| Reflect + synthesize | The prompt optimiser's two sub-agents: reflect isolates the systemic issue, synthesize rewrites the config. Split so a fix is not written to chase one bad example. |
| Specification gaming | Satisfying the stated objective while violating the intent, more reliably as optimisation improves. Contained, not fixed. Here: the "nugatory change". |
What to distrust in this note#
- One source, one team, one domain. Everything from the talk is a single conference presentation about food photography at Uber. The eval shapes generalise; the thresholds, the ordering, and the claim that this is how it should be done are one team's practice.
- Two legs means internally consistent, not externally validated. Most nodes gate slide ↔ narration, which proves the deck and the talk agree, and nothing more.
- Nothing here is measured. No pass@k values, no precision/recall figures, no before/after on the auto-tuning loop, no cost. The talk describes a system; it does not report its performance.
- Three of the most interesting claims are
single-leg(narration only, no slide): the golden dataset practice (n6), the reflect/synthesize optimiser internals (n8), and the nugatory-change reward hacking (n15). The auto-tuner is the part most worth copying and the part with the least evidence behind it. - The "Background, supplied" blocks are mine, not the source's. Confusion matrices, Reason's Swiss cheese, pass@k's origin in code benchmarks, RLHF preference training, the drift taxonomy, Goodhart, specification gaming - established prior art the talk assumes or never names. They are uncited by construction and carry no evidential weight about this source. They are here because a ramp-up without them leaves you able to repeat the talk but not to argue with it.
- A vendor talking about its own system, with the usual selection effect: the architecture that gets a conference slot is the one that worked.
Open questions#
- Does pass rate always rise with retries, or can feedback induce reward hacking?
n15's nugatory change suggests the latter is real. S4 supplies a related warning from the other end: its generator/evaluator loop improved non-monotonically - a middle iteration was sometimes preferred to the last. More loop is not uniformly more quality. Still needs a source that measures this rather than observing it. - Do the two QA gates fail independently? Section 8's justification requires it, and if both are the same judge model under different prompts, the holes may be substantially aligned. The talk does not say, and it is the cheapest thing to check in your own system.
- Who grades the grader? The QA gate is an LLM. Nothing here describes evaluating it, and the golden set anchors the tuned agents rather than the judge.
- What is the cost of the closed loop? Sampling, re-labelling and re-benchmarking on a cadence is ongoing human and compute expense. No figure is given, and it decides whether a smaller team can run this at all.
- Where does human labelling stop scaling? The loop depends on re-labelled production samples at a cadence. That is the one part of the design with no automation story.
Feeds these topics#
../../brain/topics/evals.md- the founding source; n1-n14 promoted.../../brain/topics/agents.md- n2, n8, n13 (routed multi-agent pipeline, self-tuning agents).
Presentation narrative#
A talk track for a team putting a multi-stage agent pipeline into production, derived entirely from the gated nodes above. The food-photo domain is incidental; what transfers is the mapping from stage type to metric type. This is a conference talk from one company about its own system, with no external replication and no figures anybody else can check.
Slide 1 - Stop asking whether the agent is good#
"Is the agent good?" is not a coarse question, it is an unanswerable one, because a single score over a multi-stage pipeline cannot tell you which stage failed. That is the move the whole talk turns on, and everything after it is a consequence.
Before that lands, one thing has to be unlearned. The word "eval" arrives carrying assumptions from software testing - fixed inputs, expected outputs, an assertion that passes or fails - and none of them survive here. The output is an image, quality is subjective, and there is no reference to diff against. So the thing doing the judging has to be a model, and the discipline has to come from somewhere other than assertions.
This is the goal slide, and it is worth noting what is absent. The crux is that none of the three
goals is a metric - they are properties somebody has to translate into measurements, which is the
work the rest of the talk does [n2].
Slide 2 - Nothing works until the trace is flat#
Every stage writes to one flat end-to-end trace, not nested per-agent logs, and the justification is blunt: without it you have nothing to optimise for, let alone a self-learning loop [n1].
The word doing the work is flat, and the reason is that the questions you will ask cross stages. This image came out badly - was it routed wrong, prompted wrong, or generated wrong? Per-agent logs answer each part separately and leave you stitching timestamps together. One flat record makes the whole journey legible in a single read.
This is also what makes decomposition worth anything. A pipeline of small agents only buys you localisation if the evidence arrives already correlated, so the architecture and the trace are one decision rather than two.
This is the system under test. The crux is that every arrow is a place a failure can be attributed
to, but only if the trace spans them [n1, n3].
Slide 3 - A router is a classifier, so measure it like one#
The metric is determined by what kind of thing the stage is, not chosen by taste. A router picks one of N options, which makes it a classifier, and the measurement is recall.
The asymmetry is the part worth carrying. A precision miss sends a good photo for needless enhancement, which costs compute. A recall miss lets a bad photo through, which costs the thing the system exists for. Those are not equally bad, so the router is tuned toward recall deliberately rather than toward accuracy.
This is a precision miss, shown rather than described. The crux is that this failure is visible and
cheap, while the recall miss is invisible and expensive - which is why the metric is not accuracy
[n5].
Slide 4 - A generator has no right answer, so measure the retry curve#
When there is no correct output to compare against, the useful question is how many attempts it takes to get an acceptable one. That is pass@k, and it turns an unanswerable quality question into a curve you can watch move.
The editing stage then gets the most transferable idea in the talk, and it is the one most teams never notice. An edit has a free reference: its own input. You do not need a golden answer to judge a transformation, because you can ask whether the output is better than what went in, faithful to it, complete, natural, and whether anything was removed that should not have been.
This is the pairwise rubric. The crux is that a transforming stage always has a reference available
for free, which is why editing is the cheapest stage in any pipeline to evaluate well [n7, n8].
Slide 5 - Gates leak, so stack them, and then close the loop#
Every quality gate lets something through, so the design stacks them and takes care that the holes do not line up. That is Swiss cheese, borrowed intact from safety engineering, and it is the structural answer to a stage that cannot be made perfect.
Stacked gates then need tuning, and the world does not hold still. So live traffic is sampled and re-labelled, and the system rewrites its own configs as drift appears [n9]. For leadership the significant part is that this converts a periodic manual retuning project into a standing property of the system, which changes who is on the hook and when.
This is the closed loop. The crux is that the loop's input is production traffic rather than a fixed
benchmark, which is what lets it track a world that moves [n9].
Slide 6 - One loop is not enough, because the loop will game the metric#
A loop optimising a proxy finds the cheapest way to move that proxy, which is rarely the way that moves the goal. This is expected behaviour from a working optimiser rather than a malfunction, so vigilance is not the counter.
The answer the talk gives is three loops on three clocks, each watching something the others cannot game. That is the part most teams' understanding stops short of, and it is the reason to read this rather than a generic piece about proxy metrics.
On trust: this is one company describing its own production system in a conference talk. There is no external replication, no ablation, and no figure anybody outside Uber can check. The mechanisms are the value and they are unusually concrete; the outcomes are self-reported. Adopt the stage-to-metric mapping and the flat trace today, and treat every result as an existence proof.
This is the closing structure. The crux is that the loops run at different frequencies deliberately
- a fast loop that can be gamed is checked by a slow one that cannot [n10, n11].
Key takeaway message#
Stop asking whether the agent is good, because a single score over a pipeline cannot say which stage failed. Log one flat end-to-end trace first, since decomposition only buys attribution if the evidence arrives correlated. Then judge each stage by what kind of thing it is: a router is a classifier measured on recall, a generator has no right answer so measure the retry curve, and an editor has a free reference in its own input. Stack the gates so their holes do not line up, close the loop on sampled production traffic, and run more than one loop on more than one clock, because any single loop will eventually optimise the proxy instead of the goal. The food is incidental; the mapping from stage type to metric type is what transfers.